all projects
Civian
research
solutions
impacts & reflections
Improve the experience of analyzing CSR data on Civian’s dashboard
duration
6 weeks
team
Ha Do
Krathish Prakash
Nisheta Gupta
Q Malik
role
ux research
tester recruitment
user testing
interaction design
deliverables
hi-fi prototypes
client presentation
full usability test report

Civian is a platform that provides data visualizations for Corporate Social Responsibility (CSR) employees, especially Credit Union executives, to make investment decisions on local businesses in the New York state. How might we ensure the map and metrics are useful to Credit Union executives when they consider local businesses for investment?
Along with 3 other designers and researchers, I conducted moderated usability tests and delivered 4 key findings with hi-fidelity design recommendations, aimed at enhancing usability and driving user acquisition.
problem
unsure if CSR staff find product useful to make investment decisions
When making a CSR investment decision for their company, executives lose time and efficiency having to refer to an enormous amount of data from different sources. Civian solved this problem with their data analysis tool.
While their previous PDF solution were successful, their productized platform has not been tested to work for their target users – Credit Union executives. Evaluating the usability of their dashboard product was crucial as they were entering the beta phase.
solution preview

research
recruiting diverse personas for diverse perspectives
We had trouble recruiting Credit Union executives as there were some NDA restrictions for Civian to share their existing clients information. As we still want the project to be the most helpful to Civian, we brainstormed alternative secondary personas that are more accessible to us in the 2-week recruitment time frame.
Roles recruited
Why?
CSR Specialist from other industries
experienced with CSR data
Data Analyst
experienced with reading and interpreting data
Account Supervisor
knowledgeable about the budget and metrics are important from local business could provide
Non-profit Co-founder
similarly knowledgeable about the budget and metrics are important from local business
After successfully recruited 8 participants, we conducted 40-60 minute moderated tests with each of them to assess Civian’s usability state based on our predefined goals. Taking the results from the tests gave us the following insights:
80%
had difficulty comparing stats among neighborhoods
80%
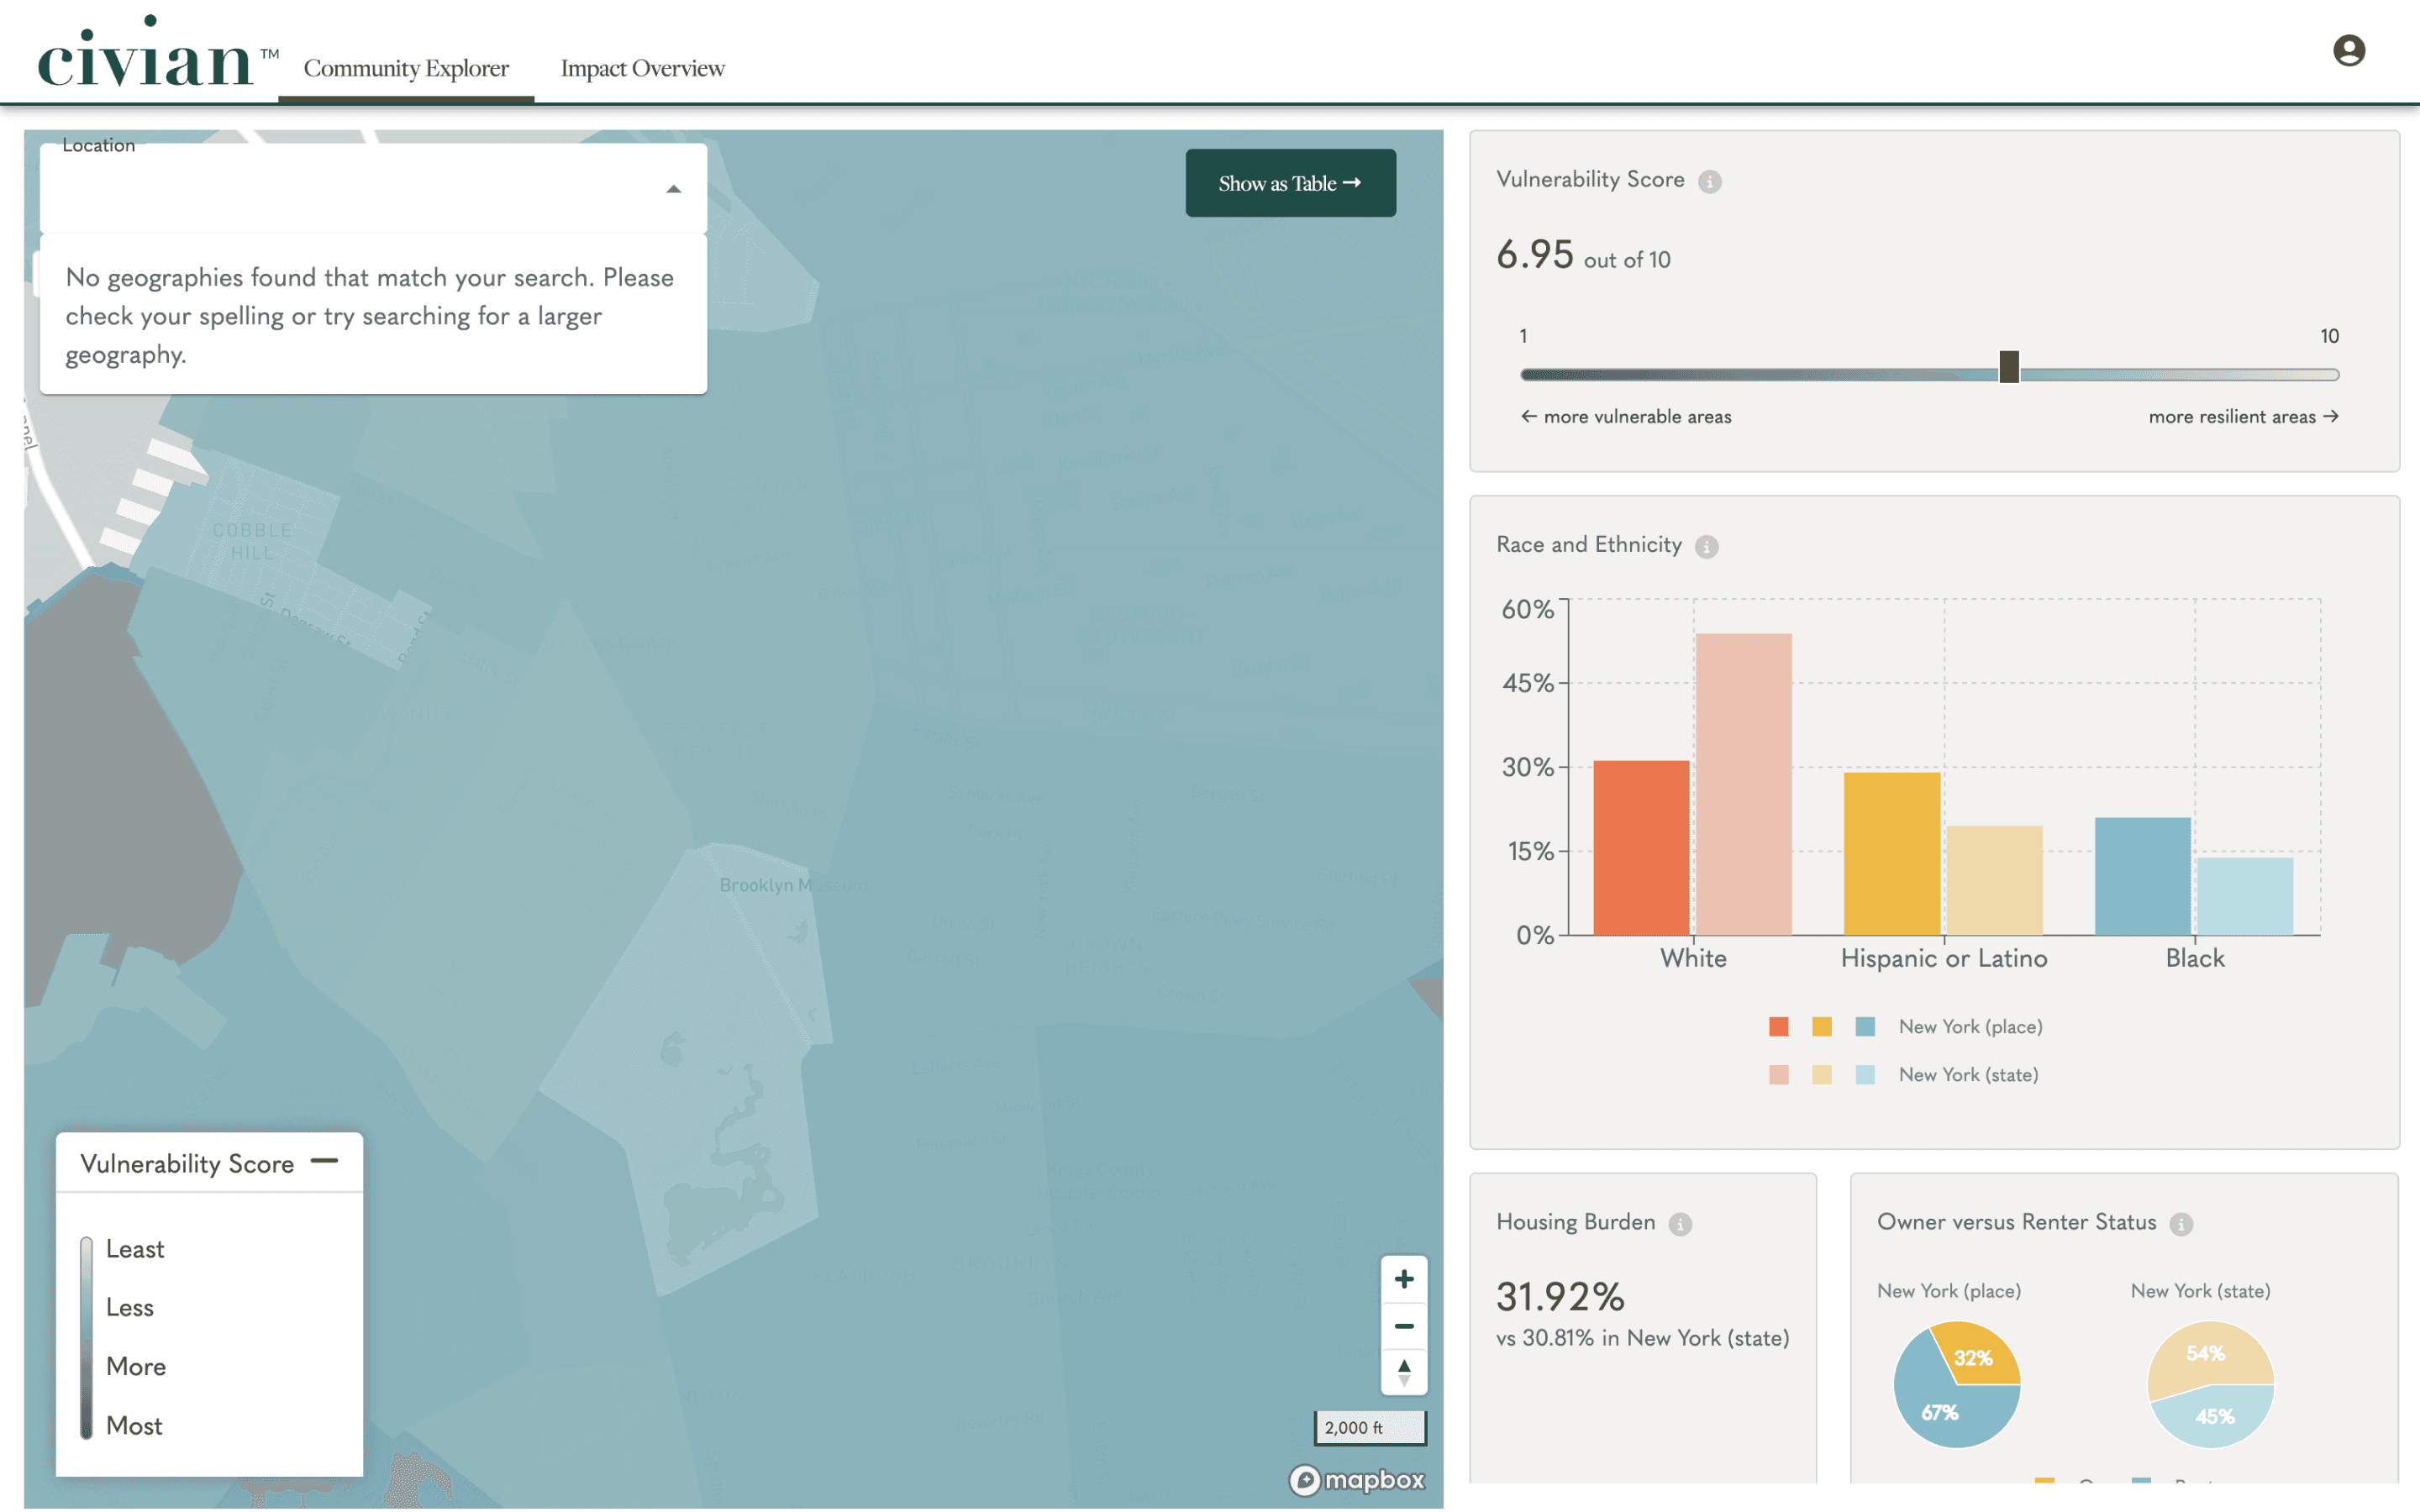
had issues with the map color and border system
63%
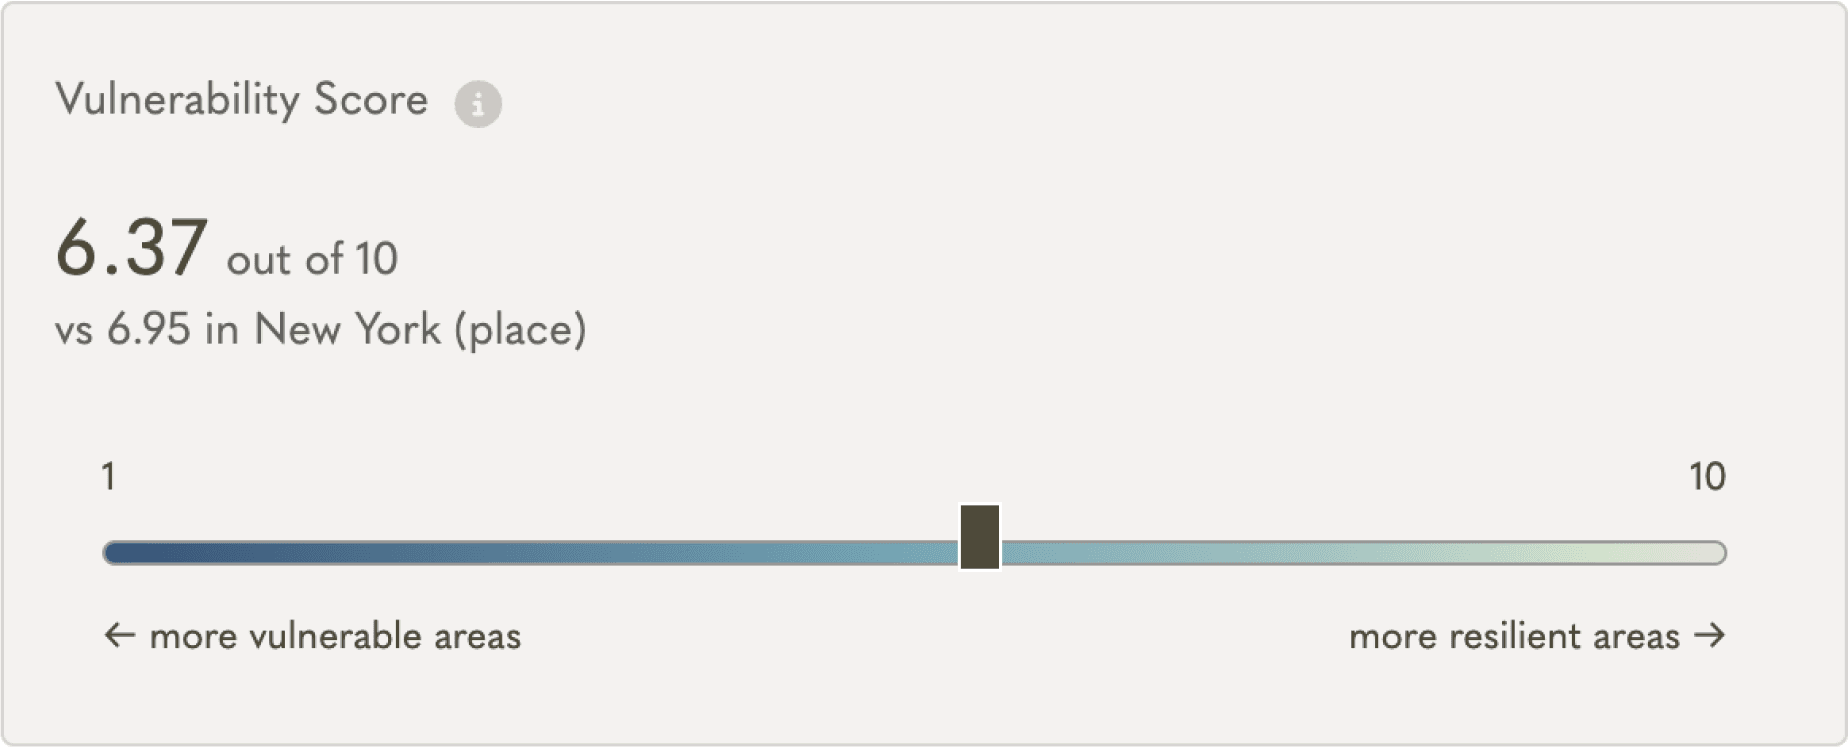
desired richer data – contexts of key metrics such as “vulnerability score” or “number of communities”
63%
need more help understanding deeper insights while exploring data
design
the filter system
When tasked with deciding where to invest capital, 5 out of 8 testers found it difficult to compare the key statistics like vulnerability score, capital deployed, and impact score as they have to go back and forth locations or switch tabs.
“I don’t know if I need the map at this point to do much of anything...a table comparing them (numbers) would be more effective."
Original design
Our recommendation
Vulnerability Score
7.59
out of 10
GREenwich village
6.95
out of 10
ELMHURST
3.69
out of 10
Soho
6.95
7.59
3.69
filter

expanded datapoint: number of organizations
5 of 8 testers had trouble understanding the data due to the repeated use of colors. Testers also mentioned how physical boundaries between neighborhoods were difficult to distinguish.
“Colors are kinda merging, so confusing.”

added contextual onboarding
All testers wanted to break down key metrics for more detailed information. such as expanding "Organizations" to see a list of organizations impacted by the company. This limits critical context when making investment decisions.
“I would like to see more specific areas of renters and education to make more informed decisions”
civian.com


Compare locations
Elmhurst


less vulnerable areas

67%
45%
6.95
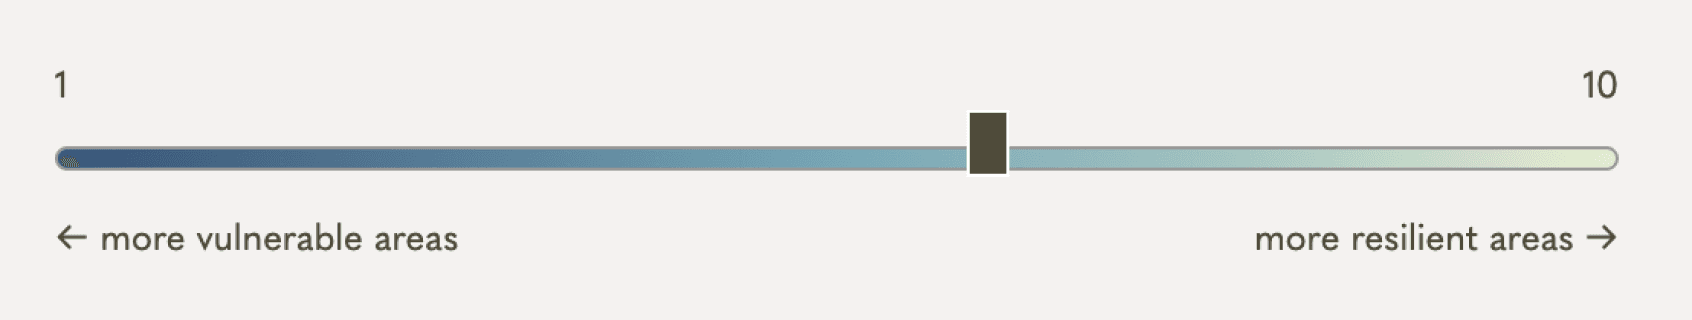
Use the slider to filter and view areas depending on their vulnerability.
Okay, got it
2/2
filter
impact
Found 87% user satisfaction using the Civian dashboard
100% participants said they would want to use this product if they were in a position to make investment decisions
Provided the Civian team the next critical steps for their product improvement in the critical time before beta testing
reflection
recruit early and creatively
The project was not possible if we gave in to perfectionism and did not recruit people who have little and indirect experience with CSR. Interpreting CSR data-insight more broadly and abstractly as “data”, “social outreach”, “social responsibility”, and “community” were super helpful for our recruitment process.
probing, redirecting and avoiding biases take practice
During a moderated test, people would do or ask unexpected things, and it takes practice to ask the right questions and extract the necessary insights out of those situations!
A word from the Civian team’s product manager:
"We love the map enhancements and the addition of the compare tab! These were features we had been considering as well but were unsure about how to implement them. Fantastic job!"
Lead 0-1 design for mindfulness mobile app | OHM Center
@Ha Do | last updated jan 2024